Infographic
sélectionné galerie de époustouflant données visualizations créé avec AntV outils.
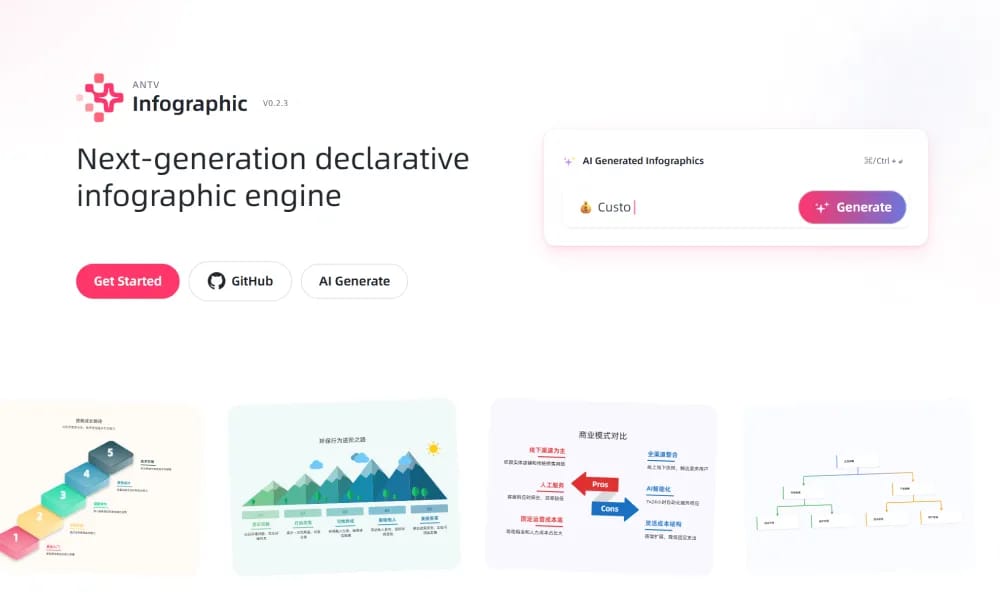
Aperçu du Produit
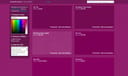
AntV Infographic (infographic.antv.vision) is an official showcase from AntV (Alibaba's open-source visualization team), featuring a beautiful collection of high-quality infographics, data stories, and interactive charts built using AntV libraries like G2, G6, G2Plot, and AVA. It serves as inspiration for designers, analysts, and developers, demonstrating real-world applications in business intelligence, reports, dashboards, and storytelling across industries like finance, health, and e-commerce. The gallery includes categorized examples with source code, live demos, and implementation details for learning and replication. Curated Examples: Hundreds of polished visualizations with themes and styles. Interactive Demos: Hover, zoom, and drill-down enabled charts. Source Access: Links to code, AntV docs, and tutorials for rebuilding. Categories: Organized by chart type, industry, and complexity.
Idéal pour
IU designers rapidement construction polished interfaces.
Fonctionnalités Clés
- sélectionné Examples: Hundreds de polished visualizations avec themes et styles.
- interactif Demos: Hover, zoom, et drill-down enabled charts.
- Source accéder: Links à code, AntV docs, et tutorials pour rebuilding.
- Categories: Organized par chart type, industry, et complexity.
Avantages
- +Open source
- +Collaboration en temps réel
- +Styles d'illustration uniques
- +Adapté aux développeurs
Inconvénients
- -La personnalisation peut nécessiter des compétences en design
- -Peut nécessiter un temps d'apprentissage
/// SPÉCIFICATIONS
- Tarif :Free
- Plateforme :Browser
PNGMaker
Transformez du texte en PNG transparents de haute qualité

Icon-Z
génère personnalisable face icônes avec random parts comme hair, eyes, et arrière-plans pour gratuit web et app utiliser.

Freepik
Freepik est un complet IA-driven créatif plateforme offrant d'archive ressources, génératif outils, et collaboratif workspaces à accelerate concevoir et content creation pour professionals worldwide.
remove.bg
alimenté par IA arrière-plan suppression outil pour images.
GEE! ME
100 Characters pack

Dicebear
gratuit ouvrir source API et bibliothèque pour génération personnalisable avatar illustrations.
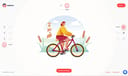
Ilus AI
IA illustration generator avec consistent style.
Transparent Textures
CSS ressource bibliothèque pour previewing et génération transparent harmonieux arrière-plan motifs.
Boring Avatars
Boring Avatars génère personnalisable SVG avatars de usernames en utilisant ouvrir source React bibliothèque avec 6 themes.
Sapiens
composant-basé character illustration builder avec des milliers de combinations.