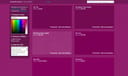
제품 개요
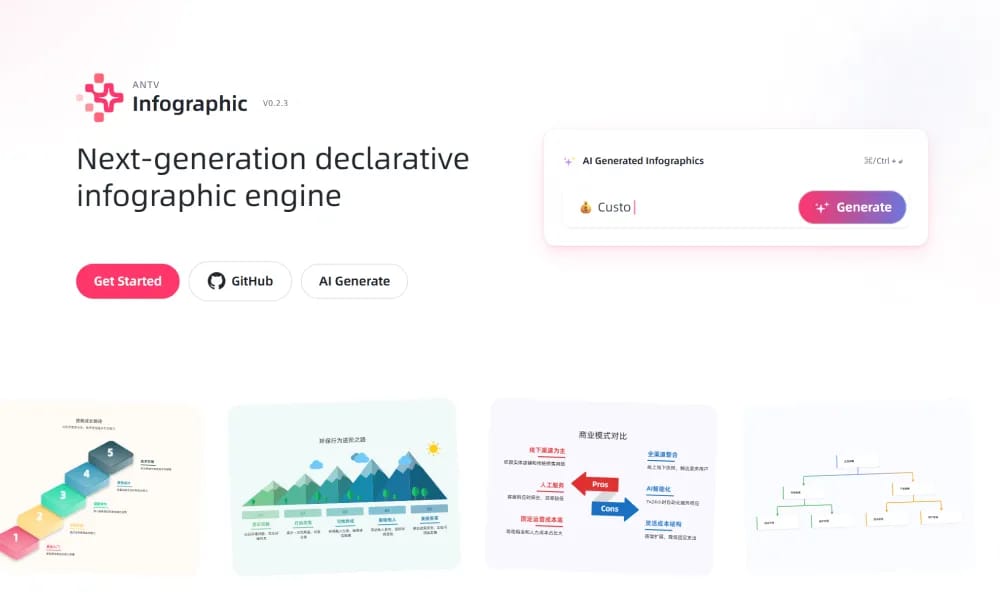
AntV Infographic (infographic.antv.vision) is an official showcase from AntV (Alibaba's open-source visualization team), featuring a beautiful collection of high-quality infographics, data stories, and interactive charts built using AntV libraries like G2, G6, G2Plot, and AVA. It serves as inspiration for designers, analysts, and developers, demonstrating real-world applications in business intelligence, reports, dashboards, and storytelling across industries like finance, health, and e-commerce. The gallery includes categorized examples with source code, live demos, and implementation details for learning and replication. Curated Examples: Hundreds of polished visualizations with themes and styles. Interactive Demos: Hover, zoom, and drill-down enabled charts. Source Access: Links to code, AntV docs, and tutorials for rebuilding. Categories: Organized by chart type, industry, and complexity.
추천 대상
UI 디자이너 빠르게 구축 polished interfaces.
주요 기능
- 엄선 Examples: Hundreds 의 polished visualizations 를 사용한 themes 및 styles.
- 인터랙티브 Demos: Hover, zoom, 및 drill-down enabled charts.
- Source 액세스: Links 로 코드, AntV docs, 및 tutorials 를 위한 rebuilding.
- Categories: Organized 에 의한 chart type, industry, 및 complexity.
장점
- +오픈 소스
- +실시간 협업
- +독특한 일러스트 스타일
- +개발자 친화적
단점
- -커스터마이징에 디자인 기술이 필요할 수 있음
- -학습 곡선이 필요할 수 있음
/// 스펙
- 가격:Free
- 플랫폼:Browser
PNGMaker
텍스트를 고품질 투명 PNG로 변환
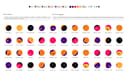
GEE! ME
100가지 캐릭터 팩으로 다양한 플랫 그래픽 일러스트레이션 제공

Ilus AI
일관된 스타일의 AI 일러스트레이션 생성기
Sapiens
수천 가지 조합이 가능한 컴포넌트 기반 캐릭터 일러스트레이션 빌더
Transparent Textures
투명 시메리스 배경 패턴을 미리보고 생성하는 CSS 리소스 라이브러리

Icon-Z
머리카락, 눈, 배경 등 무작위 부품으로 커스터마이징 가능한 얼굴 아이콘을 생성하여 웹과 앱에서 무료로 사용할 수 있습니다.

Freepik
Freepik는 포괄적인 AI-driven 크리에이티브 플랫폼 제공 스톡 에셋, 생성형 도구, 및 협업적인 workspaces 로 accelerate 디자인하다 및 content creation 를 위한 professionals worldwide.

Dicebear
무료 오픈소스 API 및 라이브러리 를 위한 생성 사용자 정의 가능 avatar 일러스트레이션.
Boring Avatars
Boring Avatars 생성합니다 사용자 정의 가능 SVG avatars 에서 usernames 사용 오픈소스 React 라이브러리 를 사용한 6 themes.
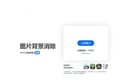
remove.bg
AI 기반 이미지 배경 제거 도구로 몇 초 만에 완벽한 컷아웃