Infographic
curated gallery of stunning data visualizations created with AntV tools.
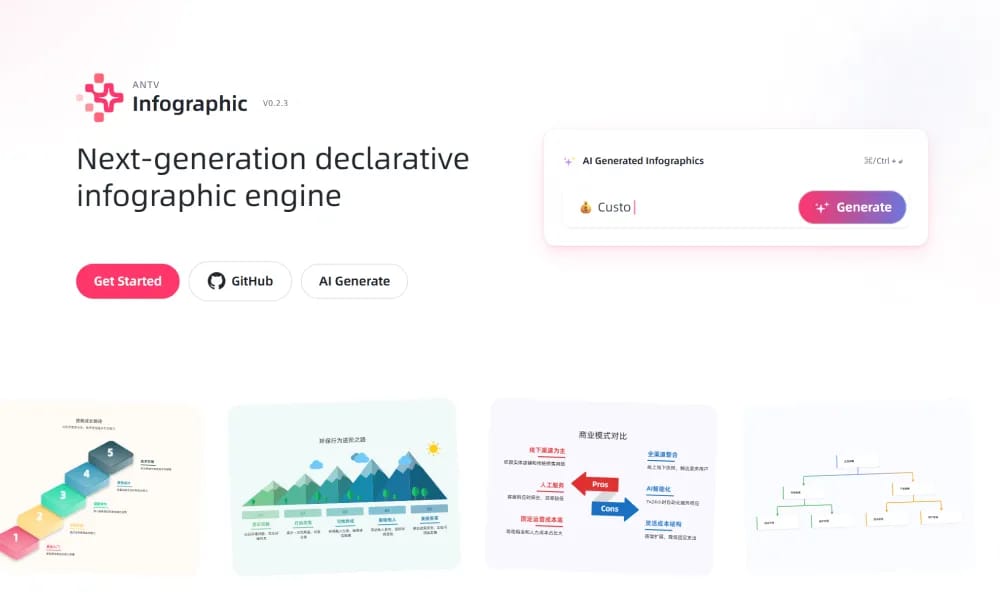
Product Overview
AntV Infographic (infographic.antv.vision) is an official showcase from AntV (Alibaba's open-source visualization team), featuring a beautiful collection of high-quality infographics, data stories, and interactive charts built using AntV libraries like G2, G6, G2Plot, and AVA. It serves as inspiration for designers, analysts, and developers, demonstrating real-world applications in business intelligence, reports, dashboards, and storytelling across industries like finance, health, and e-commerce. The gallery includes categorized examples with source code, live demos, and implementation details for learning and replication. Curated Examples: Hundreds of polished visualizations with themes and styles. Interactive Demos: Hover, zoom, and drill-down enabled charts. Source Access: Links to code, AntV docs, and tutorials for rebuilding. Categories: Organized by chart type, industry, and complexity.
Best For
UI designers quickly building polished interfaces.
Key Features
- Curated Examples: Hundreds of polished visualizations with themes and styles.
- Interactive Demos: Hover, zoom, and drill-down enabled charts.
- Source Access: Links to code, AntV docs, and tutorials for rebuilding.
- Categories: Organized by chart type, industry, and complexity.
Pros
- +Open source
- +Real-time collaboration
- +Unique illustration styles
- +Developer-friendly
Cons
- -Customization may require design skills
- -May require learning curve
/// SPECS
- Pricing:Free
- Platform:Browser
remove.bg
AI-powered background removal tool for images.

Freepik
Freepik is a comprehensive AI-driven creative platform offering stock assets, generative tools, and collaborative workspaces to accelerate design and content creation for professionals worldwide.
PNGMaker
Turn text prompts into high-quality transparent PNG images
Sapiens
Component-based character illustration builder with thousands of combinations.

Icon-Z
generates customizable face icons with random parts like hair, eyes, and backgrounds for free web and app use.
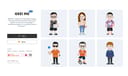
GEE! ME
100 Characters Pack

Dicebear
free open-source API and library for generating customizable avatar illustrations.
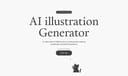
Ilus AI
AI illustration generator with consistent style.
Transparent Textures
A CSS resource library for previewing and generating transparent seamless background patterns.
Boring Avatars
Boring Avatars generates customizable SVG avatars from usernames using open-source React library with 6 themes.